
Chapitre 11
TP Info
Méthode d'Euler
Ressource affichée de l'autre côté.
Faites défiler pour voir la suite.
Faites défiler pour voir la suite.
Énoncé
Soit f la fonction définie sur \R par f(x)=\frac{1}{1+x^{2}}.
On souhaite approcher par la méthode d'Euler la primitive \text{F} de f vérifiant \text{F}(0) = 0.
On choisit de représenter \text{F} sur \text{I} = [0 \:; 2].
On commence par choisir un pas h > 0. On pose x_0 = 0 et, pour tout entier naturel n, x_{n+1} = x_n + h, puis on définit les points \text{M}(x_n \:; y_n) proches de la courbe représentative de \text{F.}
1. Exprimer x_1 en fonction de h.
2. Justifier que y_0 = 0.
3. En utilisant l'approximation \mathrm{F}(a+h) \approx \mathrm{F}(a)+h \times f(a) avec h proche de 0 et a appartenant à \text{I,} exprimer y_1 en fonction de h.
On souhaite approcher par la méthode d'Euler la primitive \text{F} de f vérifiant \text{F}(0) = 0.
On choisit de représenter \text{F} sur \text{I} = [0 \:; 2].
On commence par choisir un pas h > 0. On pose x_0 = 0 et, pour tout entier naturel n, x_{n+1} = x_n + h, puis on définit les points \text{M}(x_n \:; y_n) proches de la courbe représentative de \text{F.}
Questions préliminaires
1. Exprimer x_1 en fonction de h.
2. Justifier que y_0 = 0.
3. En utilisant l'approximation \mathrm{F}(a+h) \approx \mathrm{F}(a)+h \times f(a) avec h proche de 0 et a appartenant à \text{I,} exprimer y_1 en fonction de h.
Ressource affichée de l'autre côté.
Faites défiler pour voir la suite.
Faites défiler pour voir la suite.
Construire sur \boldsymbol{[0 \:; 2]}, point par point avec la méthode d'Euler, une approximation de la courbe représentative de la solution d'un problème du type \boldsymbol{y}^{\prime}(\boldsymbol{x})=\boldsymbol{f}(\boldsymbol{x}) et \boldsymbol{y}\left(\boldsymbol{x}_\boldsymbol{0}\right)=\boldsymbol{y}_\boldsymbol{0}, en utilisant une des deux méthodes.
Ressource affichée de l'autre côté.
Faites défiler pour voir la suite.
Faites défiler pour voir la suite.
Méthode de résolution 1
Tableur
Dans une feuille de calcul, on construit un tableau donnant les valeurs de x_n et y_n, où n est un entier naturel de 0 à 20.
On entre la valeur 0 dans la cellule B2, la valeur 0 dans la cellule C2 et on choisit pour pas h = 0{,}1.
On obtient alors la feuille de calcul suivante.

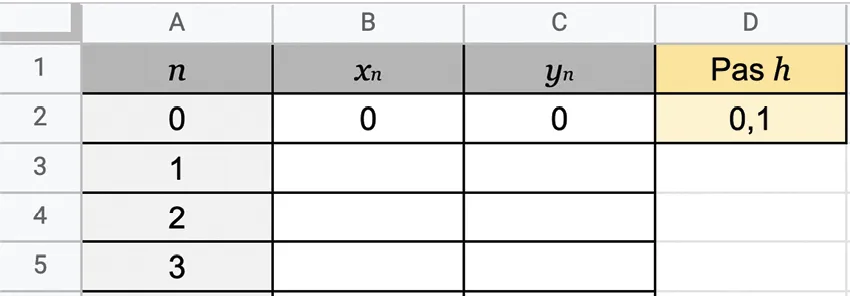
1. Quelles formules doit-on saisir dans les cellules B3 et C3, puis étirer vers le bas, pour obtenir les valeurs sucessives de x_n et de y_n ?
2. Représenter le nuage de points \text{M}(x_n \:; y_n).
On entre la valeur 0 dans la cellule B2, la valeur 0 dans la cellule C2 et on choisit pour pas h = 0{,}1.
On obtient alors la feuille de calcul suivante.
1. Quelles formules doit-on saisir dans les cellules B3 et C3, puis étirer vers le bas, pour obtenir les valeurs sucessives de x_n et de y_n ?
2. Représenter le nuage de points \text{M}(x_n \:; y_n).
Ressource affichée de l'autre côté.
Faites défiler pour voir la suite.
Faites défiler pour voir la suite.
Méthode de résolution 2
Python
On donne ci‑après un programme en langage Python qui permet d'afficher une approximation de la courbe représentative de \text{F} sur l'intervalle \text{I} = [0\: ; 2].
1. Que représente y_0 ?
2. Compléter la ligne 4 du programme.
3. Que représentent les variables \color{purple}\bf{h} et \color{purple}\bf{n} ?
4. Compléter le programme dans la boucle \color{purple}\bf{for} pour afficher une approximation de la courbe représentative de \text{F} sur l'intervalle \text{I} = [0 \:; 2].
5. Afficher cette approximation de la courbe représentative de \text{F} sur l'intervalle \text{I} = [0 \:; 2] pour n = 1\:000.
from matplotlib.pyplot import *

def f(x):
  return ...

def Euler(fonctionf, x0, y0, xf, n):
  x = x0
  y = y0
  X = [x]
  Y = [y]
  h = (xf-x0)/n
  for i in range(n):
    x = x + h
    y = ...
    X.append(x)
    Y.append(y)
  plot(X, Y, 'ro')
  grid()
  show()
Ressource affichée de l'autre côté.
Faites défiler pour voir la suite.
Faites défiler pour voir la suite.
En complément du nuage de points représenté, faire apparaître la courbe représentative de la fonction arctangente définie sur \R par x \mapsto \arctan (x) (fonction ATAN sur Excel ou arctan de la bibliothèque Python numpy).
Quelle conjecture peut‑on émettre ?
Quelle conjecture peut‑on émettre ?
Une erreur sur la page ? Une idée à proposer ?
Nos manuels sont collaboratifs, n'hésitez pas à nous en faire part.
j'ai une idée !
Oups, une coquille
